
Geography studies the Earth’s surface, physical properties, and the human societies living on it. Geographers try to understand why geographical things are where they are, how they change, and how people interact with the environment.
An essential element is cartography, which is the study and practice of making and using maps. Perspective systems like Google Maps have greatly enhanced the scope, variable scale, and ease of using mapping techniques on planet Earth by combining mapping projections with satellite and ground-based data such as architecture and traffic information. Nevertheless, all maps rely on a perspective projection of one kind, an essential feature of how the map is created and used regarding the interpretation, accuracy, and precision of presented data.
Mercator Projection
The fundamental problem is projecting the (approximately) spherical Earth’s surface onto a flat map. No 2-D map of a spherical earth can be perfect because you must first peel off the Earth’s skin and then pin it down. This mathematical process introduces distortions, and of course, because all projections suffer from a lack of one-to-one mapping, the question comes down to which one has the least distortion, is easiest to use, or is most convenient or accurate for a particular application or usage scenario.
One solution is the Mercator projection, a conformal cylindrical map projection first presented by Flemish geographer and mapmaker Gerardus Mercator in 1569. Conformal mapping means preserving the correct angles between directions within small areas, while distorting distances. In the 18th century, Mercator projection became the standard for navigation because it represented rhumb lines as straight lines.
A rhumb line, is a line on the Earth’s surface that follows a constant compass bearing and crosses all meridians at the same angle. Rhumb lines are useful for navigation because the bearing (azimuth) does not change along the route (all straight lines, like the line from London to New Delhi, are lines of constant direction). They are added to maps to help with navigation, especially on sea charts. However, using rhumb lines, the Mercator cylindrical projection inflates the size of lands the further they are from the equator. Therefore, landmasses such as Greenland appear larger than landmasses near the equator.
There are different kinds of Mercator projection, but all suffer from the same drawbacks as mentioned above. Nowadays, the Mercator projection is widely used because, aside from marine navigation, it is easy to understand and well suited to internet maps.

Dymaxion Map (and Perspective Up/Down)
The Dymaxion Map was invented by architect Buckminster Fuller in 1943, is also called the Fuller projection, being a polyhedral map projection of the Earth’s surface onto the unfolded net of an icosahedron. The resulting map is segmented to reduce shape and size distortion compared to other world maps, but the interruptions lie in the ocean.
Unlike other polyhedral map projections, the Dymaxion map does not use a gnomonic projection (perspective projection through the Earth’s centre onto the polyhedral surface), which causes length distortion away from the centre of each face. Instead, each triangle’s three edges on the Dymaxion map match the scale along the corresponding arcs of great circles on the Earth (modelled as a sphere). Then the scale diminishes toward the middle of the triangle. Notably, the Dymaxion map does not have any “right way up”. Fuller argued that in the universe there is no “up” and “down”, or “north” and “south”: only “in” and “out”.
The Dymaxion map proved difficult to use. It is also somewhat confusing to describe the four cardinal directions and readily locate geographic coordinates. For example, the shortest route from Africa to South America is not obvious. In addition, depending on how the map is projected, land masses and oceans are often divided into several pieces.

A New Type of World Map
Many mapping projections are known, but none have been developed in quite some time. Then recently, in 2021, Dr. J. Richard Gott invented a new Azimuthal projection, a double-sided disk map designed to minimise all types of map distortions. Gott re-imagined maps of the earth, whereby it is not just the sizes of landmasses that change in mapping, but shapes of, and distances between, landmasses.
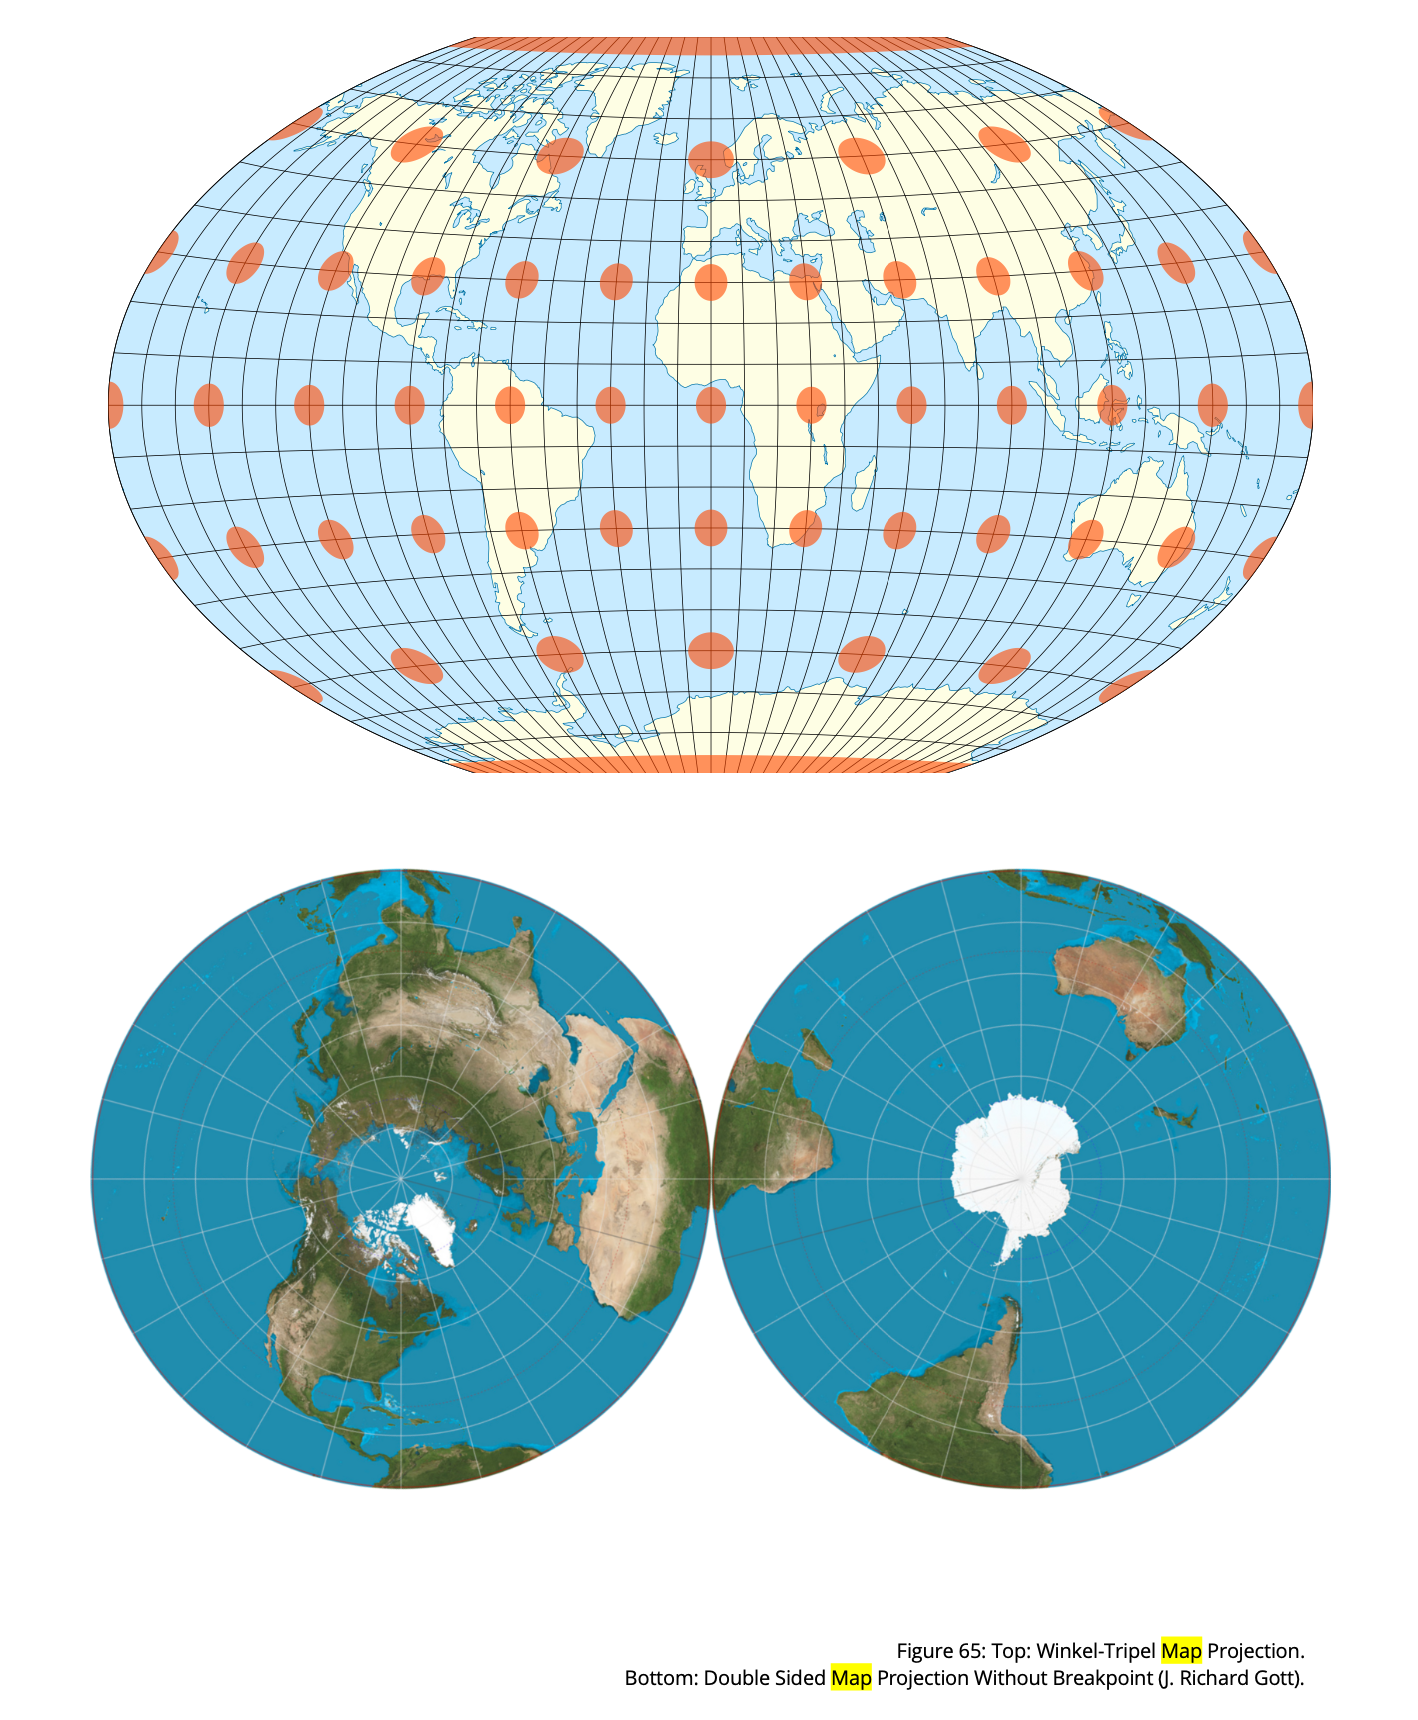
Dr. Gott wanted to strike a balance between the three kinds of errors: size, shape, and distance, and he worked out a scoring system that could sum these different kinds of error. He then examined all possible projections and found the one that minimised the sum of the three types of error: the Winkel-Tripel projection. However, a distortion persisted being a mathematical incision line or breakpoint, often running from pole to pole down the Pacific. The resulting shape cannot be stretched and pulled back over the unbroken surface of a sphere.
A solution was found in a new double-sided map, that skips the oddly shaped topological boundary entirely. The resultant circular map continues over the edge. It is not a true map because you can see only half of the planet at once. However, this is no different than the 3-D globe because, in the double-sided map, you simply flip it. It is suggested that users print it out, and glue it back-to-back for convenient use.

You must be logged in to post a comment.